© O'Reilly Publishers (Used with permission)
This URL is http://www.stewart.cs.sdsu.edu/cs575/lecs/ch06.html
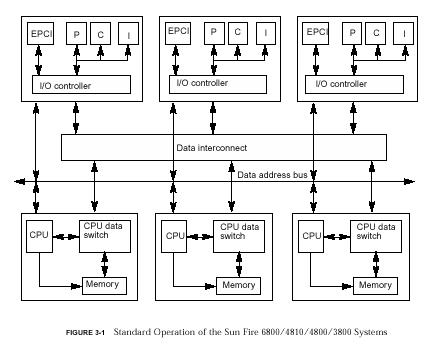
Recall RISC architectures are Ch2: pipelined to ensure efficient use of the separate hardware devices
Earlier in the semester, we examined tools to allow the programmer to easily time an entire program, or any UNIX command, when in the csh.
Using time csample
Fig. 6-2 Sharp Profile - dominated by routine 1
© O'Reilly Publishers
(Used with permission)
Fig. 6-3 Flat profile - no routine dominates
© O'Reilly Publishers
(Used with permission)
Fig. 6-4 Simple Call Graph
© O'Reilly Publishers
(Used with permission)
gprof is a useful UNIX tool that requires recompiliation of all codes with the -pg option. As you'll see below, extensive data is collected including the call graph as well as the ordered list of modules and their CPU percent usage. There is no alterative of the user source code, say to insert system timer calls.
Sun Doc Analyzing Program Performance - Appendix A gives examples using Gprof
Modified from our text, p. 118,
cat input100
10
10
cat input200
10
20
cat input400
10
40
# script to run the test data and accumlate gprof summaries
# don't forget to    nice +19 runit
limit cputime 3600
nice +19 diffusion < input100
mv gmon.out gmon.1
nice +19 diffusion < input200
mv gmon.out gmon.2
nice +19 diffusion < input400
mv gmon.out gmon.3
# typo in our text p. 118 (no "-s")
gprof diffusion  gmon.1 gmon.2 gmon.3 > gprof.summary.out
What is produced by the profiler?
Fig. 6-5 FORTRAN example
© O'Reilly Publishers
(Used with permission)
Fig. 6-6 Quantization errors in profiling
© O'Reilly Publishers
(Used with permission)